31

I would like to merge two colormaps into one, such that I can use one cmap for negative values and the other one for positive values.

At the moment I do it with masked arrays and plotting one image with one cmap and the other image with the other, resulting in:
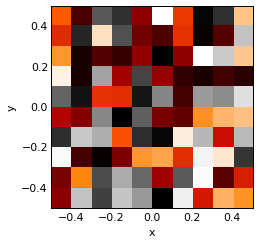
enter image description here

with the following data

dat = np.random.rand(10,10) * 2 - 1
pos = np.ma.masked_array(dat, dat<0)
neg = np.ma.masked_array(dat, dat>=0)

I plotted pos with gist_heat_r and neg with binary.

I would like to have a single colorbar with the combined cmap's, so this is not the correct approach for me.

So, how do I take two existing cmaps's and merge them into one?

EDIT: I admit, this is a duplicate, but the answer that's given is much more clear here. Also the example images make it more clear.
3
  • 1
    Interesting question. But for your case, you would normally use a diverging colormap (two hues, one for positive numbers another for negative ones). your combination of reds and greys is available in plt.cm.RdGy. This yields a continuous map around zero. If I'm not mistaken you have a discontinuity at 0. Is that what you want?
    – hitzg
    Commented Jun 25, 2015 at 13:44
  • Thank you for your answer, but that is not what I want. The positive and negative values mean something else. And to stay coherent in the paper I'm writing, I would like to use the same cmap in all pictures, which it the one for positive values.
    – johnbaltis
    Commented Jun 25, 2015 at 13:47
  • possible duplicate of stacking colormaps
    – tmdavison
    Commented Jun 25, 2015 at 14:02

2 Answers 2

51

Colormaps are basically just interpolation functions which you can call. They map values from the interval [0,1] to colors. So you can just sample colors from both maps and then combine them:

import numpy as np
import matplotlib.pyplot as plt
import matplotlib.colors as mcolors

data = np.random.rand(10,10) * 2 - 1

# sample the colormaps that you want to use. Use 128 from each so we get 256
# colors in total
colors1 = plt.cm.binary(np.linspace(0., 1, 128))
colors2 = plt.cm.gist_heat_r(np.linspace(0, 1, 128))

# combine them and build a new colormap
colors = np.vstack((colors1, colors2))
mymap = mcolors.LinearSegmentedColormap.from_list('my_colormap', colors)

plt.pcolor(data, cmap=mymap)
plt.colorbar()
plt.show()

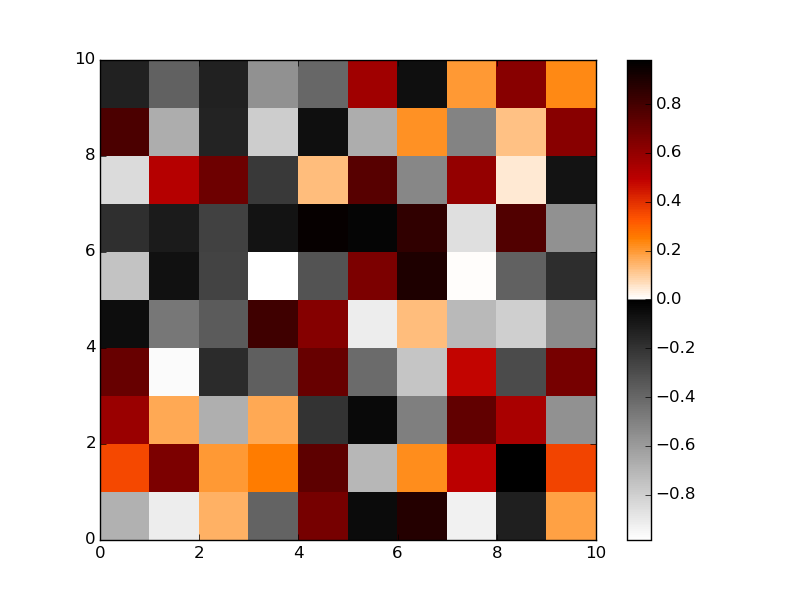
Result: enter image description here

NOTE: I understand that you might have specific needs for this, but in my opinion this is not a good approach: How will you distinguish -0.1 from 0.9? -0.9 from 0.1?

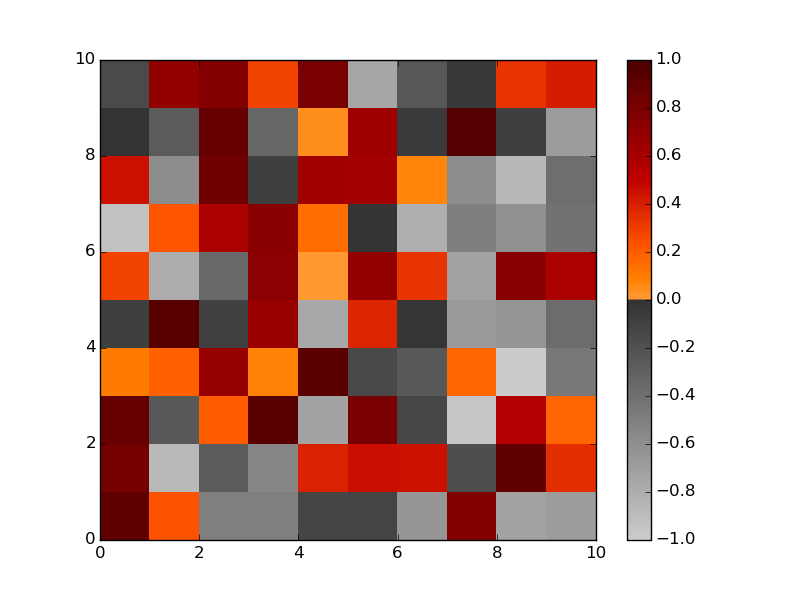
One way to prevent this is to sample the maps only from ~0.2 to ~0.8 (e.g.: colors1 = plt.cm.binary(np.linspace(0.2, 0.8, 128))) so they wont go all the way up to black:

enter image description here

5
  • This is exactly what I wanted, thanks! Clean solution, perfect!
    – johnbaltis
    Commented Jun 25, 2015 at 14:14
  • Any idea how to do it in a function where the two colors maps names are given as parameters? plt.cm[color_map_name] doesn't seem to to work
    – Noam Peled
    Commented Aug 18, 2016 at 21:27
  • Regarding the worry on same different values mapping to same color. Some times this is desired, such as if your data is an angle. Then 0=2*pi for instance. In that case to choose colors as colors1 = plt.cm.gray(np.linspace(0., 1, 128)) and colors2 = plt.cm.hot_r(np.linspace(0., 1, 128)) makes a lot of sense. Commented Sep 19, 2016 at 13:47
  • 1
    @NoamPeled use getattr. Like such (adding the predefined matplotlib colormap to your list of colormaps to stack): cmaplist.append(getattr(plt.cm,'coolwarm')(np.linspace(0,1,256,endpoint=False)+0.5/256)). Note for my purposes I needed some specific endpoint customization to avoid overlaps. ( wanted to have multiple 1-D heatmaps with different colormaps on a single pcolormesh. Here for details: stackoverflow.com/questions/43761430/…
    – Vlox
    Commented May 4, 2017 at 20:47
  • This is great. I am trying this approach for a scatter plot, but the colorbar has a strange effect with the split going above 0 (picture). Any ideas?
    – rll
    Commented Jan 9, 2019 at 11:48
0

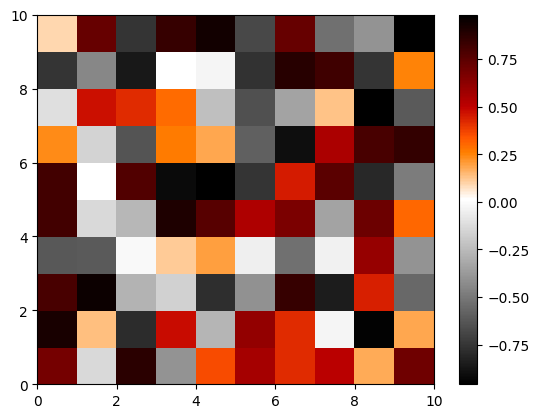
I agree with the accepted answer but in order not to sample just between ~0.2 to ~0.8, you can for example reverse the binary colormap. Here is how to do it.

colors1 = plt.cm.binary_r(np.linspace(0., 1, 128))
colors2 = plt.cm.gist_heat_r(np.linspace(0, 1, 128))

colors = np.vstack((colors1, colors2))
mymap = mcolors.LinearSegmentedColormap.from_list('my_colormap', colors)

plt.pcolor(data, cmap=mymap)
plt.colorbar()
plt.show() 

The main change is replacing plt.cm.binary with plt.cm.binary_r.

enter image description here

Your Answer

By clicking “Post Your Answer”, you agree to our terms of service and acknowledge you have read our privacy policy.

Not the answer you're looking for? Browse other questions tagged or ask your own question.