6

This is an update of my previous similar question, the same task only I need to do it within sf framework.


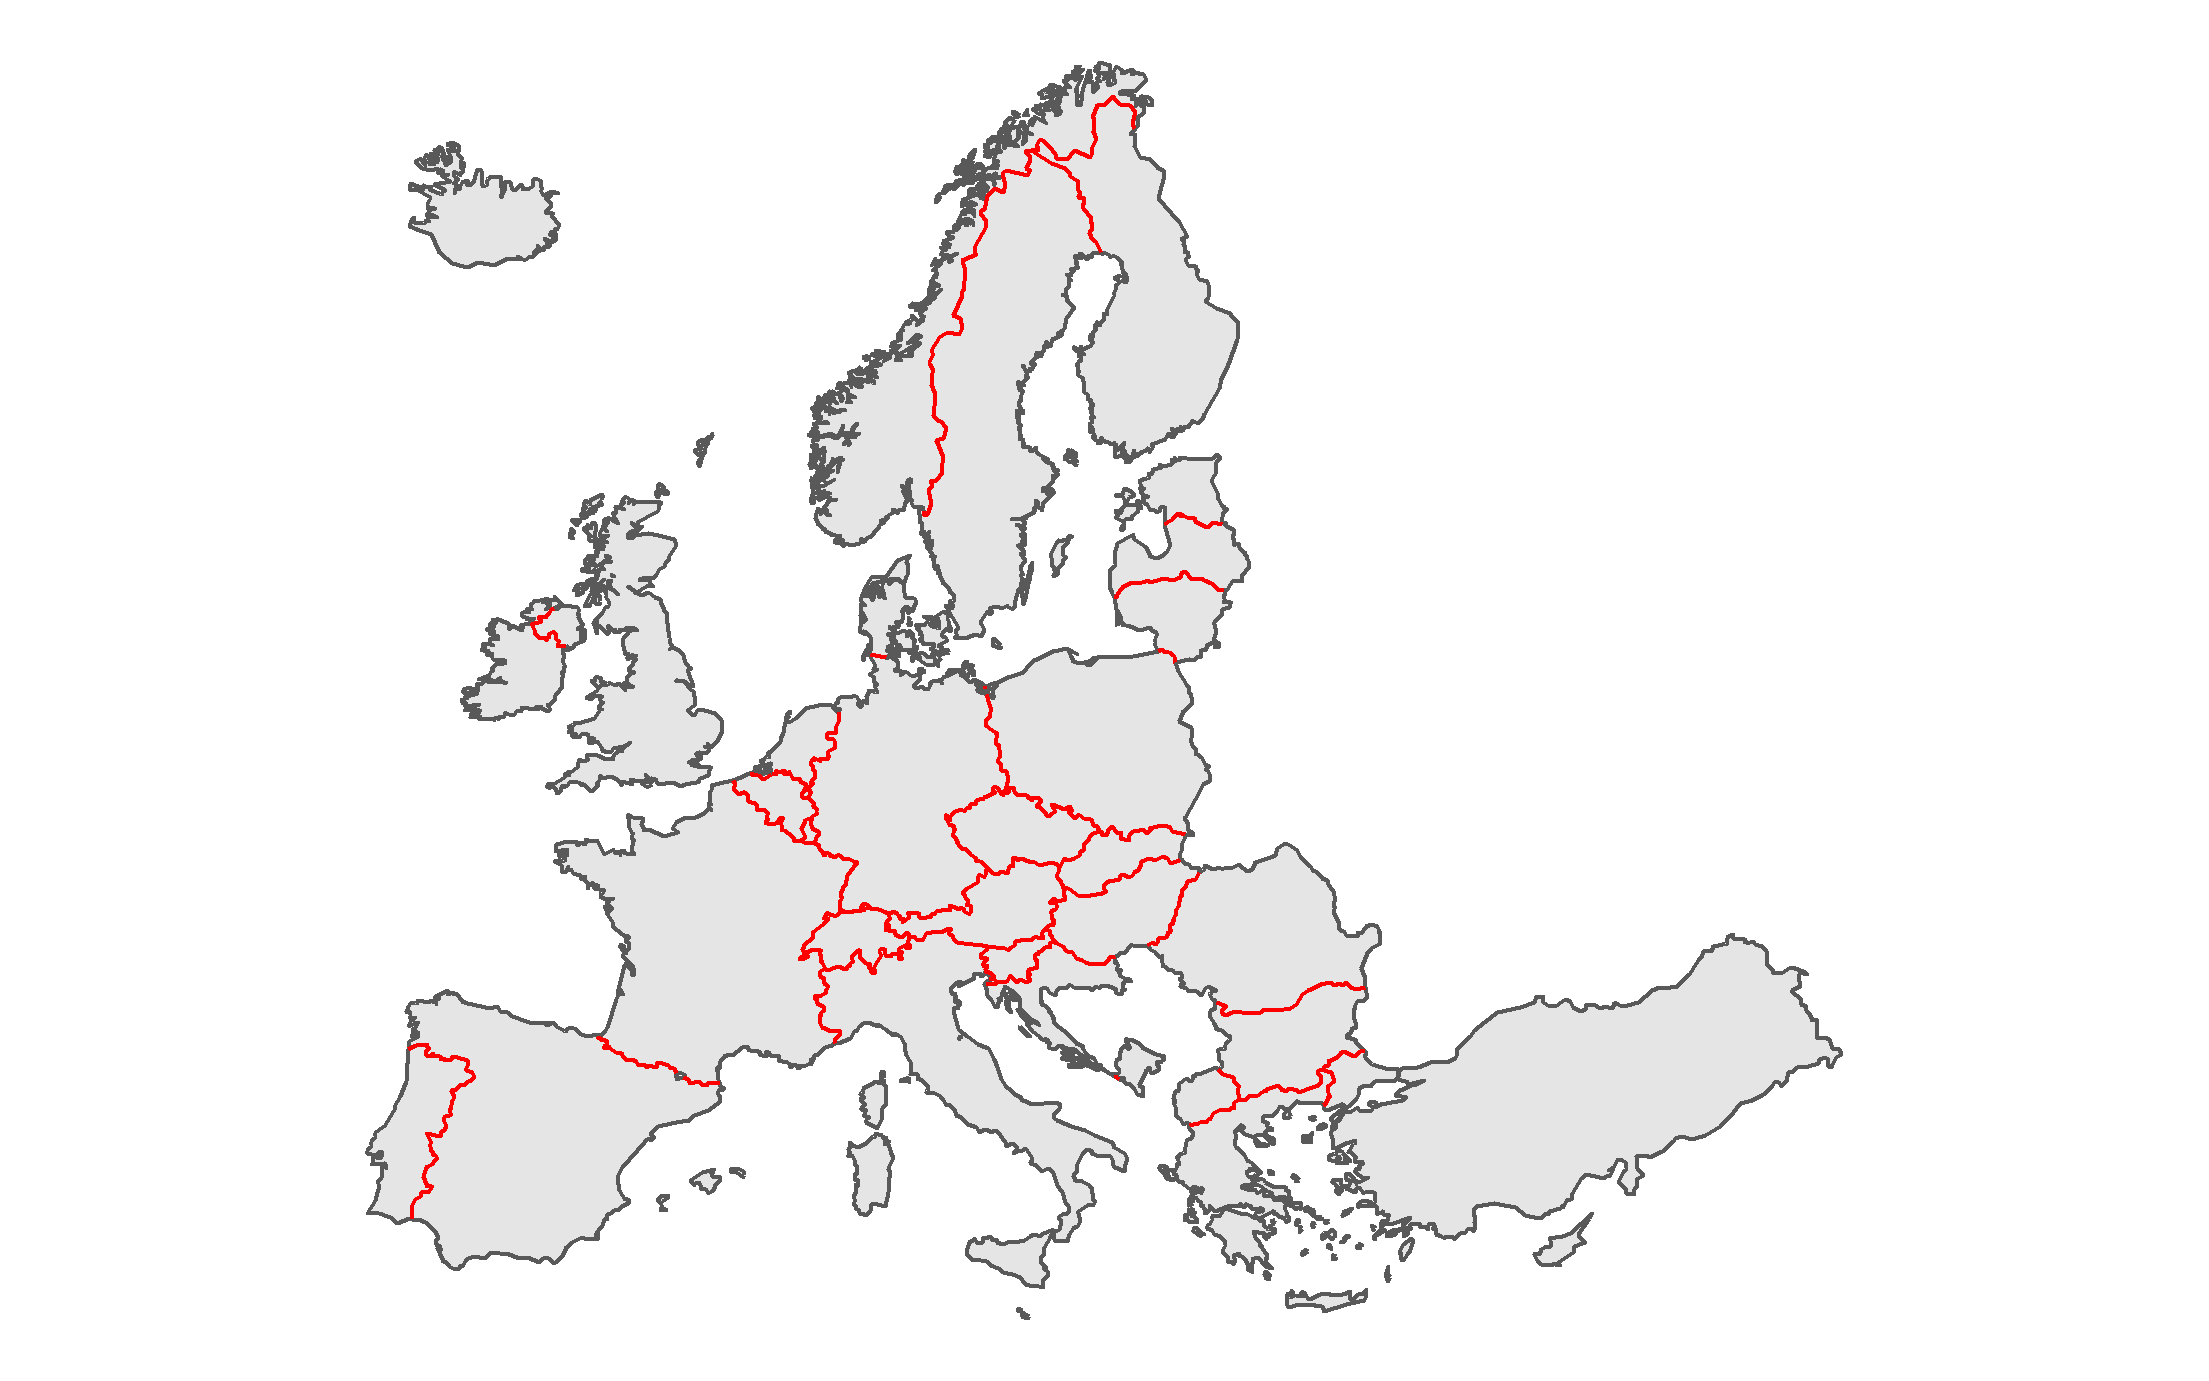
I need to identify the inner boundaries between polygons, red lines in this map.

enter image description here


Within sp framework I used to utilize a self written function that wrapped @Spacedman's answer. Here it is:

identify_borders <- function(SPolyDF){
    require(rgeos)
    require(sp)
    borders <- gDifference(
            as(SPolyDF,"SpatialLines"),
            as(gUnaryUnion(SPolyDF),"SpatialLines"),
            byid=TRUE)

    df <- data.frame(len = sapply(1:length(borders), 
                                  function(i) gLength(borders[i, ])))
    rownames(df) <- sapply(1:length(borders), 
                           function(i) borders@lines[[i]]@ID)

    SLDF <- SpatialLinesDataFrame(borders, data = df)
    return(SLDF)
}

Alternatively one may use raster::boundaries().


Code to get the spatial data and replicate the map

# dev version of ggplot2 for geom_sf()
devtools::install_github("tidyverse/ggplot2")

library(tidyverse)
library(sf)

load(url("https://ikashnitsky.github.io/share/1712-so-q-identify-borders/geodata.Rdata"))

ggplot() + 
        geom_sf(data = gd_nuts0) + 
        geom_sf(data = gd_borders, color = "red") + 
        coord_sf(datum = NA) + 
        theme_void()
2 Answers 2

8

rmapshaper uses javascript, that is cheating! I tried:

i = st_intersection(gd_nuts0, gd_nuts0)
i2 <- i[i$nuts_id != i$nuts_id.1,]
plot(gd_nuts0[1])
plot(i2, add = TRUE, col  ='red', lwd = 2)

enter image description here

5

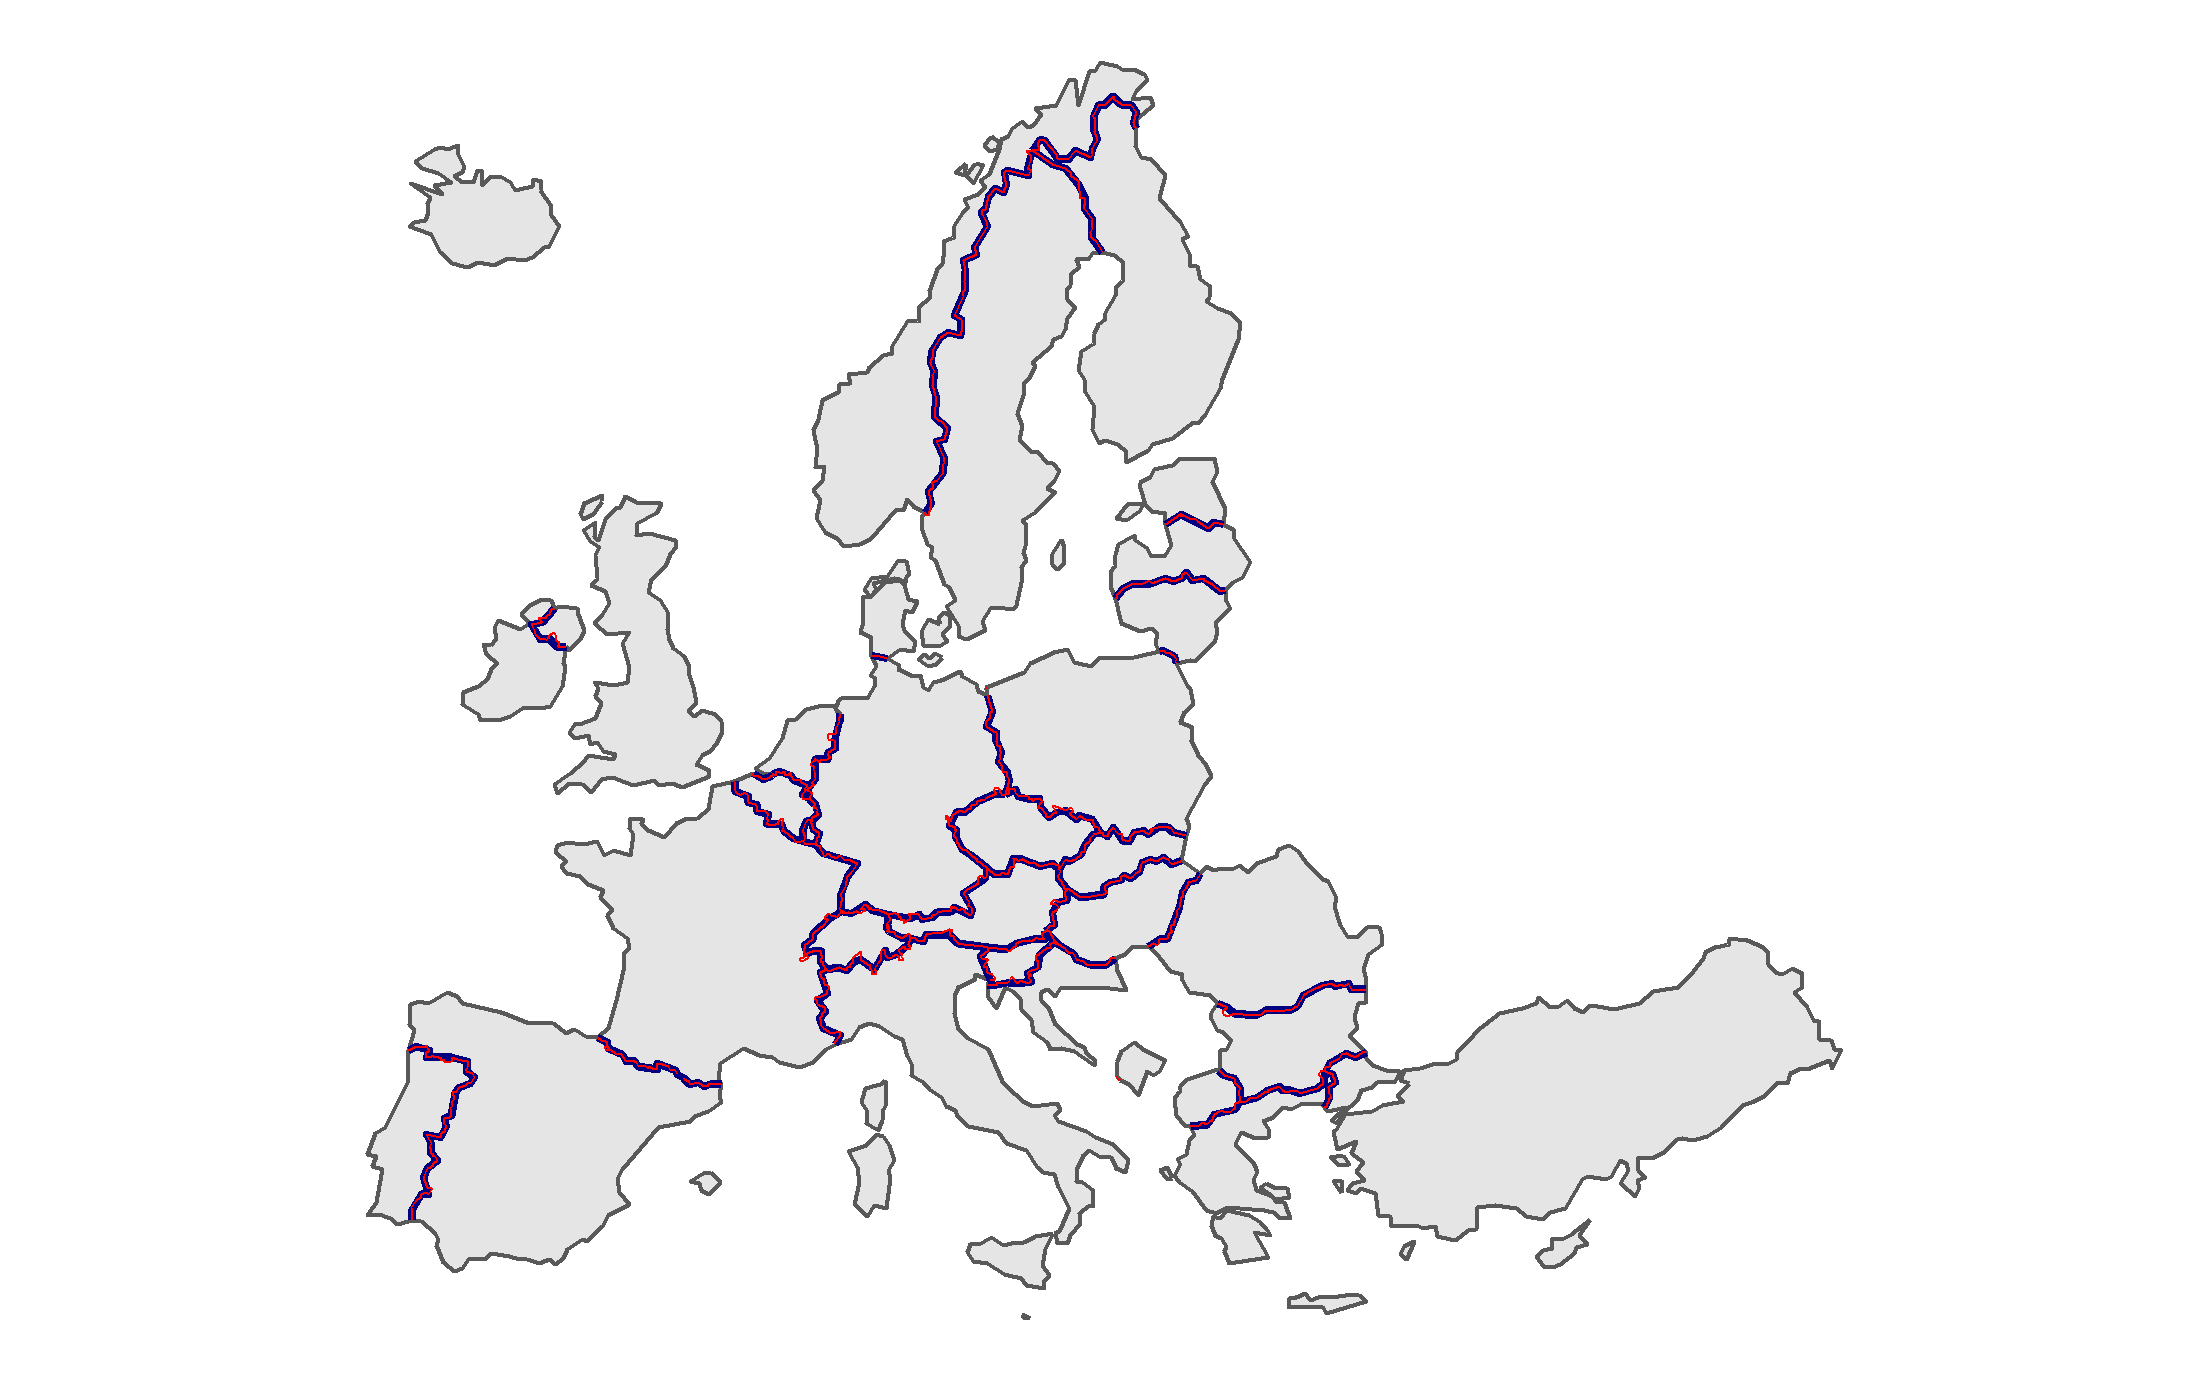
It turned out that rmapshaper has precisely the desired function and works with sf objects nicely -- ms_innerlines(). The only difficulty (possibly a bug) is that ms_innerlines() returns a list rather than an sf object. But this odd behavior is easily fixed. Below is the solution code. Note that I simplify the initial polygons to see the difference. The new inner borders that are created from an sf object are plotted in navy color.

# dev version of ggplot2 for geom_sf()
devtools::install_github("tidyverse/ggplot2")

library(tidyverse)
library(sf)
library(rmapshaper)

load(url("https://ikashnitsky.github.io/misc/171211-so-question-identify-borders/geodata.Rdata"))

sf_poly_simp <- gd_nuts0 %>% 
        ms_simplify(keep = .2, keep_shapes = TRUE) 

sf_bord_simp <- sf_poly_simp %>% 
        ms_innerlines() %>% 
        as_tibble() %>% 
        st_as_sf()

ggplot() + 
        geom_sf(data = sf_poly_simp) + 
        geom_sf(data = sf_bord_simp, color = "navy", size = 1) + 
        geom_sf(data = gd_borders, color = "red", size = .1) + 
        coord_sf(datum = NA) + 
        theme_void()

enter image description here

Your Answer

By clicking “Post Your Answer”, you agree to our terms of service and acknowledge you have read our privacy policy.

Not the answer you're looking for? Browse other questions tagged or ask your own question.