0

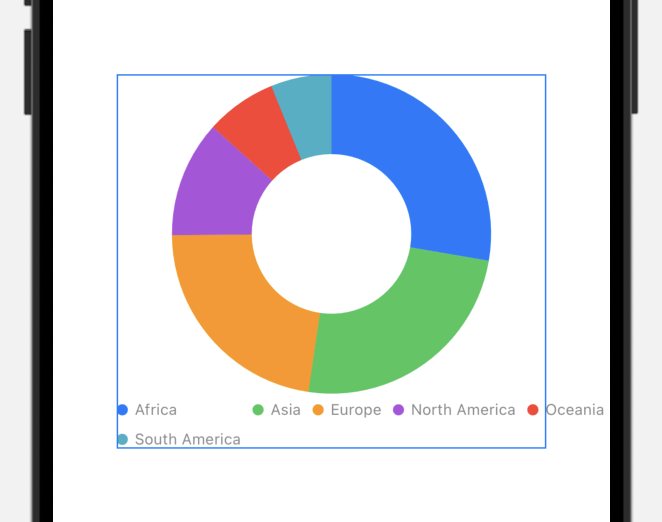
I'm building an app that lets users create charts with custom values and while testing, I came up with this bug that happens when the view width forces the legend to have more than 1 line. Due to Swift trying to align the different labels vertically, it's forcing the first line to overflow.

Legend overflowing the frame

Here's the code to generate this:

import SwiftUI
import Charts


struct DonutView: View {
    var countries:[(country:String, count:Int)] = [
        (country: "Africa", count: 54),
        (country: "Asia", count: 48),
        (country: "Europe", count: 44),
        (country: "North America", count: 23),
        (country: "Oceania", count: 14),
        (country: "South America", count: 12),
    ]
    
    var body: some View {
        Chart {
            ForEach(0..<countries.count, id:\.self) { idx in
                SectorMark(
                    angle: .value(countries[idx].country, countries[idx].count),
                    innerRadius: .ratio(0.5)
                )
                .foregroundStyle(by: .value("label", countries[idx].country))
            }
        }
        .frame(width: 310, height: 270)
        .border(.blue, width: 1)
    }
}

Has anyone seen this? Is there a solution?

I know about building custom legends, but SwiftUI has no wrapping HStack nor VStack, and the app allows users to change the legend position from the bottom to the top or sides. If I were to go this way, I'd have to write a very large chunk of code to bypass what seems to be a bug.
2
  • I agree this is a bug. Perhaps use something like this?
    – Sweeper
    Commented Nov 29 at 14:04
  • Thanks @Sweeper, that looks really good. I'd love to get this fixed, but that seems to make writing the extra code more manageable.
    – Rodrigo
    Commented Nov 29 at 14:15

1 Answer 1

0

I agree that this is a SwiftUI bug. In the meantime, you can write your own legend using a custom layout like SwiftUI-Flow.

let foregrounds: KeyValuePairs<String, Color> = [
    "Africa" : .red,
    "Asia": .green,
    "Europe": .blue,
    "North America": .yellow,
    "Oceania": .orange,
    "South America": .purple
]
Chart {
    ForEach(0..<countries.count, id:\.self) { idx in
        SectorMark(
            angle: .value(countries[idx].country, countries[idx].count),
            innerRadius: .ratio(0.5)
        )
        .foregroundStyle(by: .value("label", countries[idx].country))
    }
}
.chartForegroundStyleScale(foregrounds)
.chartLegend {
    HFlow {
        ForEach(foregrounds, id: \.key) { kvp in
            Label {
                Text(kvp.key)
                    .foregroundStyle(.foreground)
            } icon: {
                Image(systemName: "circle.fill")
                    .foregroundStyle(kvp.value)
            }
        }
    }
}

Your Answer

By clicking “Post Your Answer”, you agree to our terms of service and acknowledge you have read our privacy policy.

Not the answer you're looking for? Browse other questions tagged or ask your own question.