1

Currently I'm reading Eloquent Javascript book and at chapter 4. This topic entitled 'The lycanthrope’s log ' is very confusing to me. How important is correlation and coefficient in real world programming?

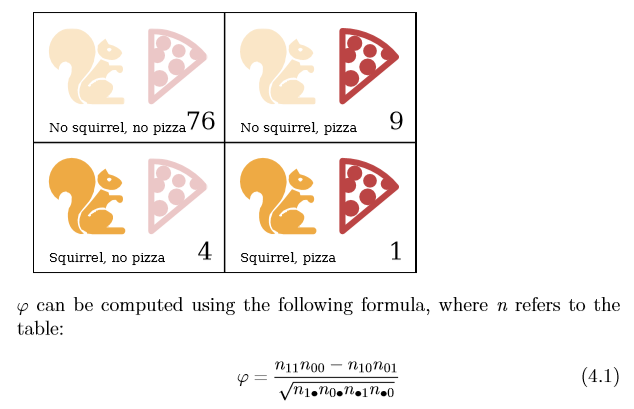
I'm trying to understand the formula used to find correlation. I've far forgotten maths since I left my high school. Could, someone who've read this book, explain to me in detail, please? Below is the picture I'm wondering about.. enter image description here
6
  • He gave this example just to show how to set and retrieve data in objects. I believe it's a better idea asking this in statistics SE community. Regarding your question: it depends on what are you programming. Just the other day I wrote a code that uses Pearson's correlation coefficient... I searched online and found what i needed to build the function. Commented Jun 10, 2016 at 5:29
  • 1
    I'm voting to close this question as off-topic because it is not about a programming problem. Commented Jun 10, 2016 at 5:31
  • @GerardoFurtado, could you provide the link for statistic SE community?
    – 112233
    Commented Jun 10, 2016 at 5:32
  • 1
    Here: stats.stackexchange.com Commented Jun 10, 2016 at 5:35
  • 2
    @GerardoFurtado, thanks posted there..
    – 112233
    Commented Jun 10, 2016 at 5:38

1 Answer 1

3

The formula is actually pretty straight forward. Consider the table from your question.

The table states that there were a total 90 observations

Out of all 90 observations:

  1. 76 times, no pizzas or squirrel
  2. 9 times, pizzas but no squirrel
  3. 4 times, squirrel but no pizzas
  4. 1 time, both squirrel and pizza

So we want to find out how Pizzas & Squirrels are related:


Consider the equation along with your table now,

(since squirrel is on the left)

n00 denotes an observation where there was no squirrel or pizza (1)

n01 denotes an observation where there was no squirrel but pizza (2)

n10 denotes an observation where there was squirrel but no pizza (3)

n11 denotes an observation where there was both squirrel but pizza (4)


Now that we know what these values are, let's plug them in to our formula -

correlation = (1×76 - 4×9) / √(5×85×10×80)
4
  • "out of all 90 observations"
    – Rey
    Commented Sep 24, 2017 at 10:58
  • "out of all 90 observations" eloquentjavascript.net/04_data.htm I don't know where you're seeing these 90 observations but they aren't here. Even if they are somewhere else, it's super confusing they're not on this page.
    – Rey
    Commented Sep 24, 2017 at 11:08
  • Also you didn't explain the bottom portion of the equation.
    – Rey
    Commented Sep 24, 2017 at 12:31
  • @xckpd7 the 90 observations is represented diagrammatically in the image itself. "No Squirrel, no pizza ~> 76... etc"
    – atefth
    Commented Sep 25, 2017 at 7:08

Your Answer

By clicking “Post Your Answer”, you agree to our terms of service and acknowledge you have read our privacy policy.

Not the answer you're looking for? Browse other questions tagged or ask your own question.