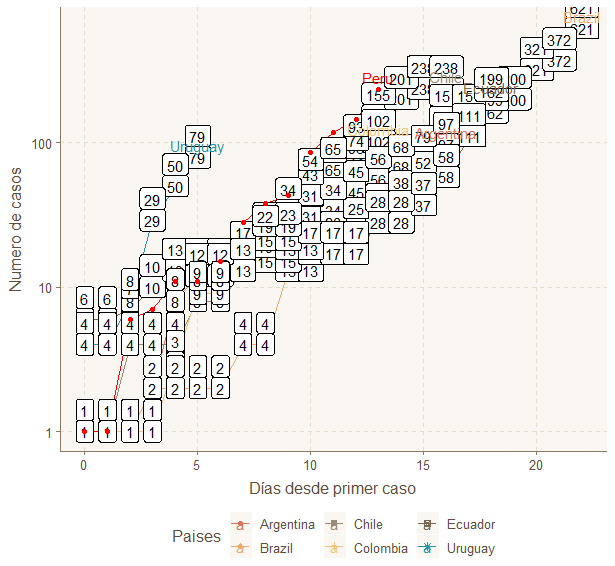
I want to apply geom label only to the last value data point of each serie. This is my database:
This is my code:
paises <- c("Peru", "Brazil", "Colombia", "Ecuador", "Chile", "Argentina", "Uruguay", "Paraguay", "Bolivia")

data <- jhu_sitrep_import(source = "confirmed") %>%
  jhu_sitrep_cleandb() %>%
  filter(country_region %in% paises) %>%
  filter(value>0) %>%
  group_by(country_region) %>%
  mutate(start = first(dates),
         d_start = dates-start,
         per = ifelse(country_region =="Peru","Per","Otros"),
         max_cases = max(value)) %>%
  filter(max_cases>30)

data %>%
  filter(per =="Otros") %>%
  ggplot(aes(x = d_start, y = value, group=country_region)) +
  geom_line(aes(col = country_region)) +
  geom_point(aes(col = country_region, shape = country_region)) +
  geom_line(dat = data %>% filter(per=="Per"), col = "red") +
  geom_label(aes(y = value, label =value), vjust = 0.5) +
  geom_label(aes(y = value, label =value ), vjust = -0.5) +
  geom_point(dat = data %>% filter(per=="Per"), col = "red") +
  geom_text(data = data %>% slice(n()) %>% filter(country_region!="Peru"),
            aes(y = value, label = country_region, col = country_region), vjust=-.5) +
  geom_text(data = data %>% slice(n()) %>% filter(country_region=="Peru"),
            aes(y = value, label = country_region), col = "red", vjust=-.5) +
  scale_fill_discrete_qualitative(palette="Pastel 1", nmax = 14, order = 5:14) +
  labs(color = "Paises", x = "Días desde primer caso", y = "Numero de casos", shape = "Paises") +
  scale_y_log10() +
  theme(legend.position = "bottom")
So with my code I get the value for each value data point. I just want the label for the last value.

