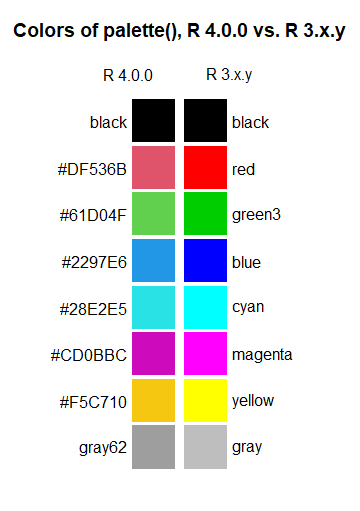
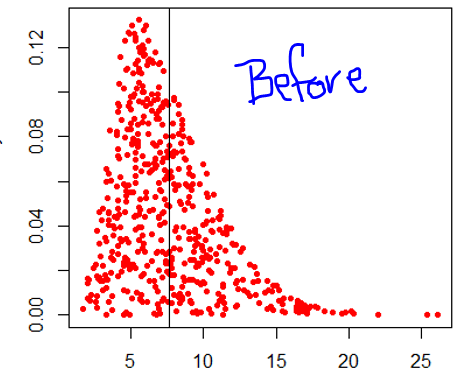
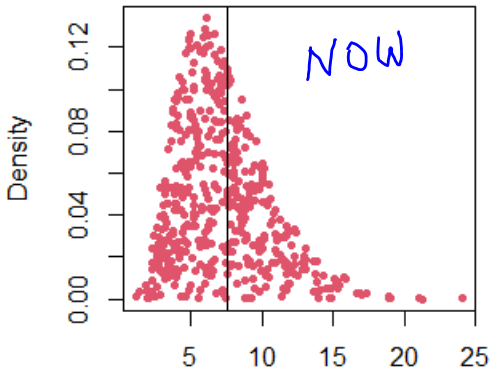
The difference in colors is due to that the default color palette changed in R 4.0.0. You can revert to the old colors by using palette("R3").
From the release news:
The palette() function has a new default set of colours (which
are less saturated and have better accessibility properties).
There are also some new built-in palettes, which are listed by
the new palette.pals() function. These include the old default
palette under the name "R3".
See also the blog post A New palette() for R
Default color palette in R 4.0.0:
palette()
# [1] "black"   "#DF536B" "#61D04F" "#2297E6" "#28E2E5" "#CD0BBC" "#F5C710" "gray62"
Revert to old default palette, "R3":
palette("R3")
palette()
# [1] "black"   "red"     "green3"  "blue"    "cyan"    "magenta" "yellow"  "gray"
Change to current default again:
palette("default")
# or
palette("R4")

palette()
# [1] "black"   "#DF536B" "#61D04F" "#2297E6" "#28E2E5" "#CD0BBC" "#F5C710" "gray62"


