6

I have been battling for a long time now to find a way to change the legend key of a ggplot2 with a hexagon. Any help or guidance are highly appreciated!

library(ggplot2)
set.seed(123)
ggplot(iris) +
  geom_jitter(aes(x=Species,y=Sepal.Length,color=Species),width=0.25) +
  guides(color= guide_legend(override.aes = list(shape = 21)))
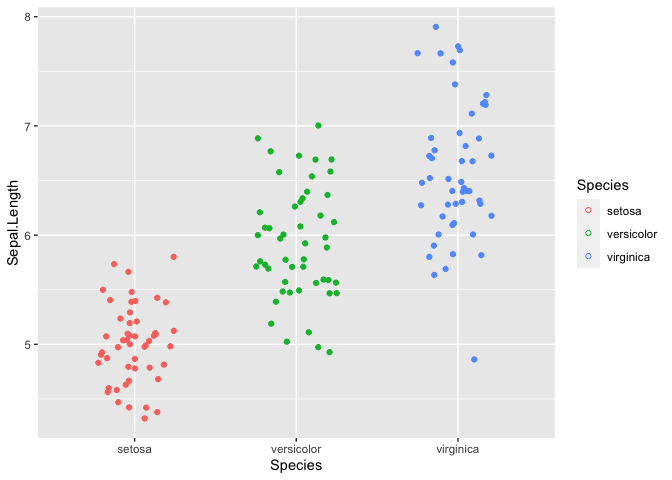
Created on 2021-11-13 by the reprex package (v2.0.1)
5
  • 1
    Just for avoidance of doubt, do you want the legend key to be a different shape to that used in the plot?
    – Peter
    Commented Nov 13, 2021 at 22:09
  • Yes, and I want an hexagon shape
    – LDT
    Commented Nov 13, 2021 at 22:10
  • I will reframe also my question to make it more straight forward. Thank you Peter
    – LDT
    Commented Nov 13, 2021 at 22:11
  • somewhat related stackoverflow.com/q/63054241/7941188
    – tjebo
    Commented Nov 14, 2021 at 10:01
  • Another option could be to use images instead, see for example stackoverflow.com/q/61327081/7941188
    – tjebo
    Commented Nov 14, 2021 at 10:06

1 Answer 1

7

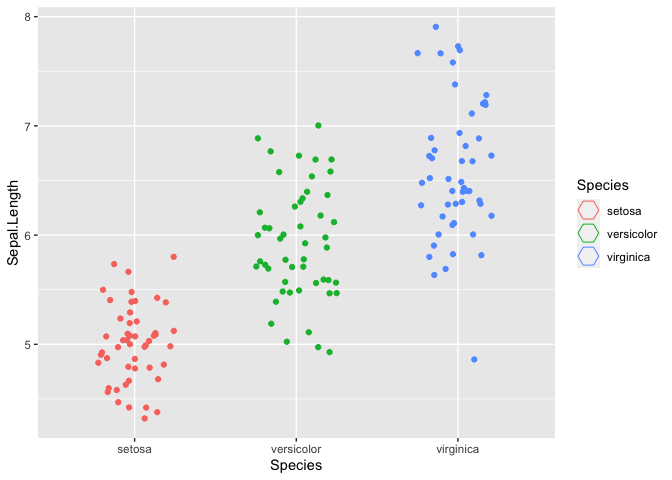
You can create keys using grid commands and then pass to a geom_ using the key_glyph argument.

A quick example:

library(grid)
library(ggplot2)

draw_key_hex <- function (data, params, size) {
    # hexagon vertex coordinates 
    v <- list(x = c(0.95, 0.725, 0.275, 0.05, 0.275, 0.725), 
              y = c(0.5, 0.110288568297003, 0.110288568297003, 0.5, 0.889711431702997, 0.889711431702997))
    # hexagon grob
    polygonGrob(v$x, v$y, 
                gp = gpar(col = data$colour,
                          fill = alpha(data$fill, data$alpha)))
}

set.seed(123)
ggplot(iris, aes(x=Species,y=Sepal.Length,color=Species)) +
  geom_jitter(width=0.25, key_glyph=draw_key_hex) 

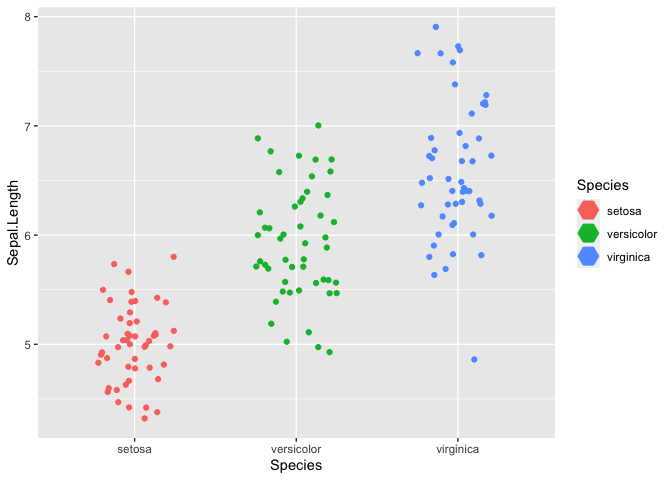
# or with fill
set.seed(123)
ggplot(iris, aes(x=Species,y=Sepal.Length,color=Species, fill=Species)) +
  geom_jitter(width=0.25, key_glyph=draw_key_hex) 

1
  • 3
    Great answer. You should add a picture of the output. It might be worth pointing out that if the hexagons look a bit small you can still increase their size by adding the line guides(color= guide_legend(override.aes = list( size = 20))) Commented Nov 13, 2021 at 23:06

Your Answer

By clicking “Post Your Answer”, you agree to our terms of service and acknowledge you have read our privacy policy.

Not the answer you're looking for? Browse other questions tagged or ask your own question.