0

I created contour lines from gridded data using d3-contour. Unfortunately I'm having trouble rendering shapes with holes properly on a mapbox map. Holes appear as an additional layer on top of the outer shape instead of cutting a hole. When drawing the same data using observable plot, the shapes are rendered correctly however. I suppose this has something to do with the winding order which is somehow handled differently in d3. Trying to fix the winding order using @turf/rewind did not bring me any further unfortunately.

To illustrate the case, I created this observable notebook. How would I go about correcting the winding order?
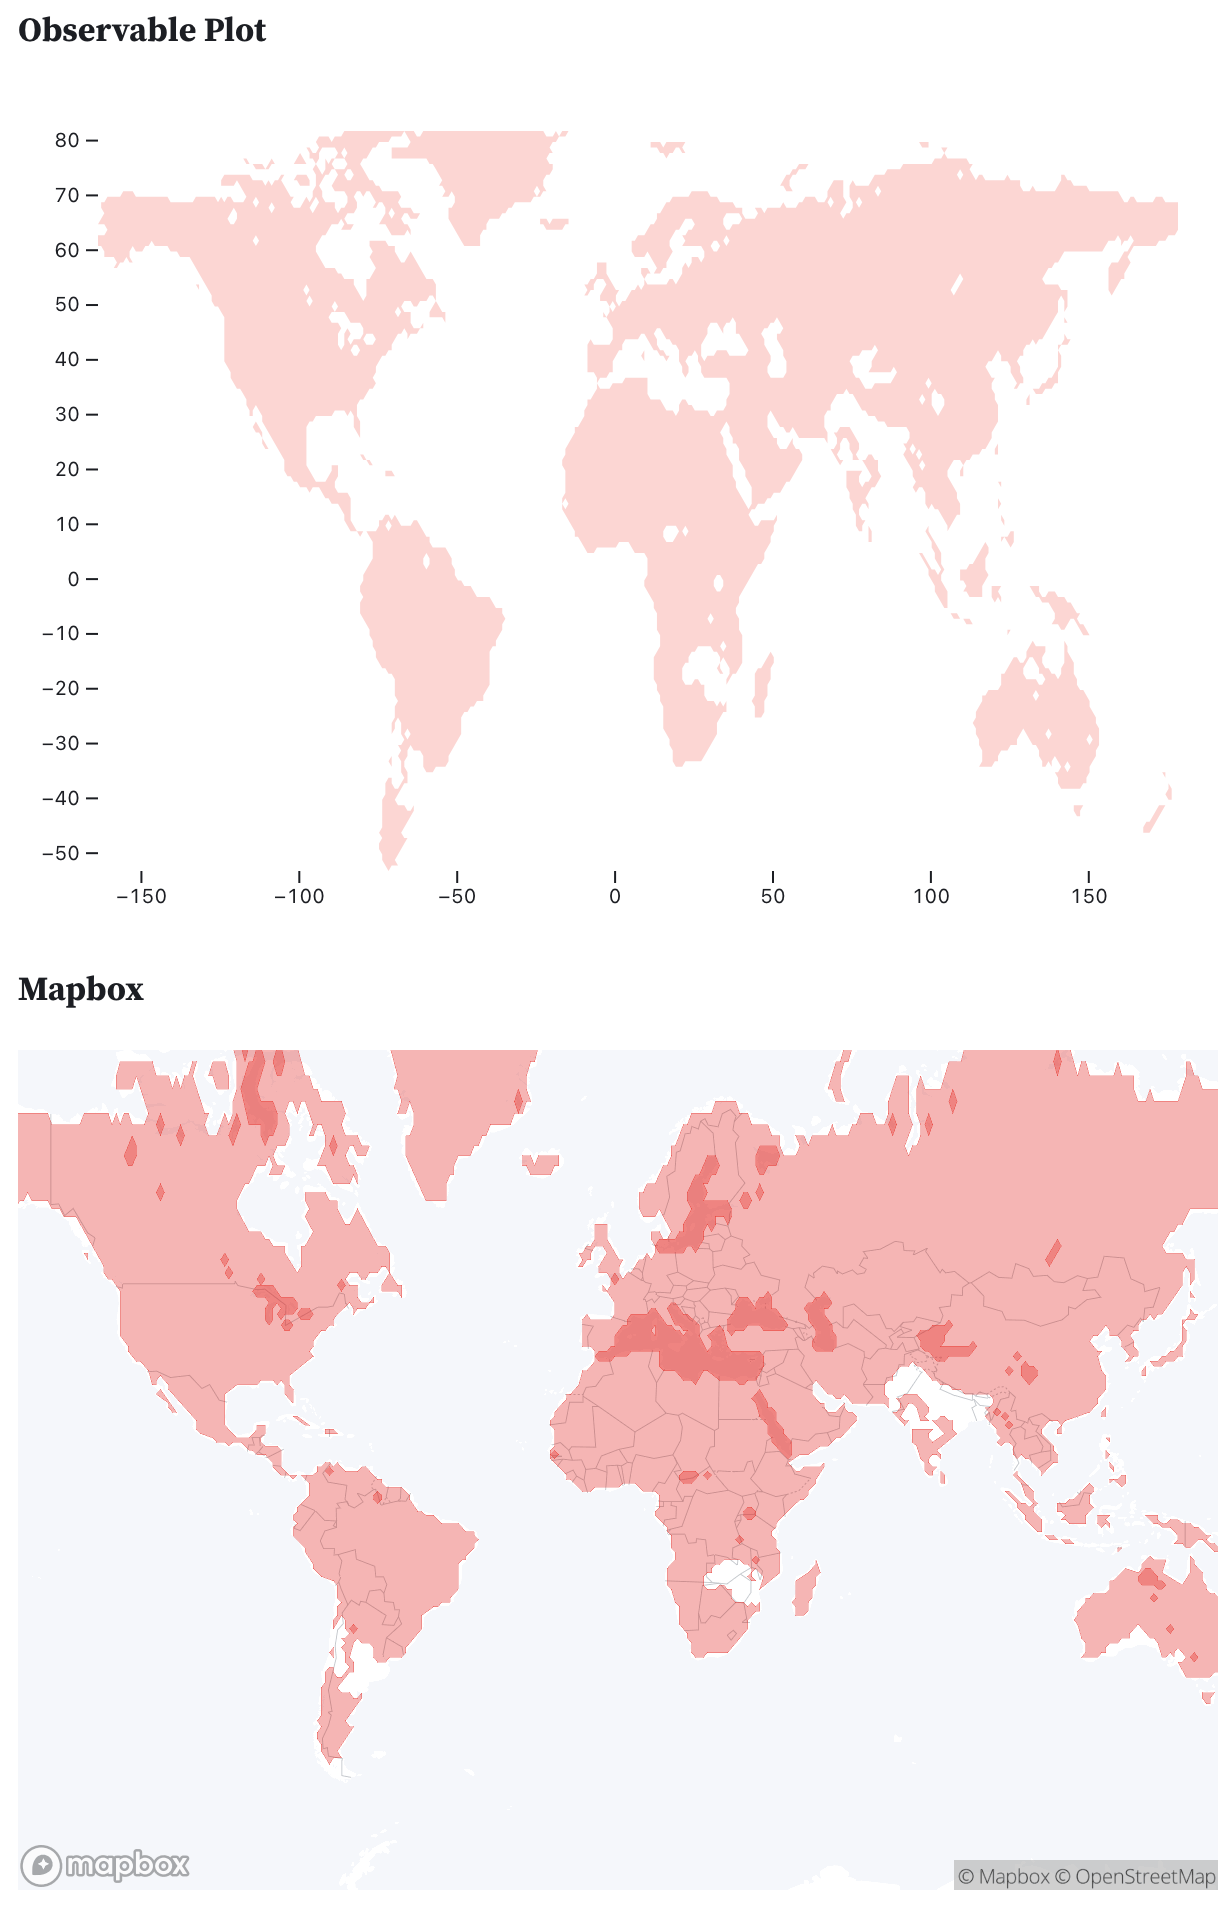
enter image description here

2 Answers 2

1

Ok I figured it out. I don't fully understand why however. Using @turf/rewind or an adaptation of this rewind function works. BUT it works only if it is applied before projecting the contours to geo/spherical coordinates.

I added the solution to the observable notebook

1
  • Cool! I do think it's worth mentioning that both methods that "fix" the GeoJSON via rewind (whether through Turf or Mapshaper) introduce artifacts. If I zoom into your map just a bit, for example, I see this image. That might be fixable by snapping points that are close together into a single point at some step. I haven't tried it. The SVG approach does not suffer from this defect. Commented Aug 29, 2023 at 13:47
0

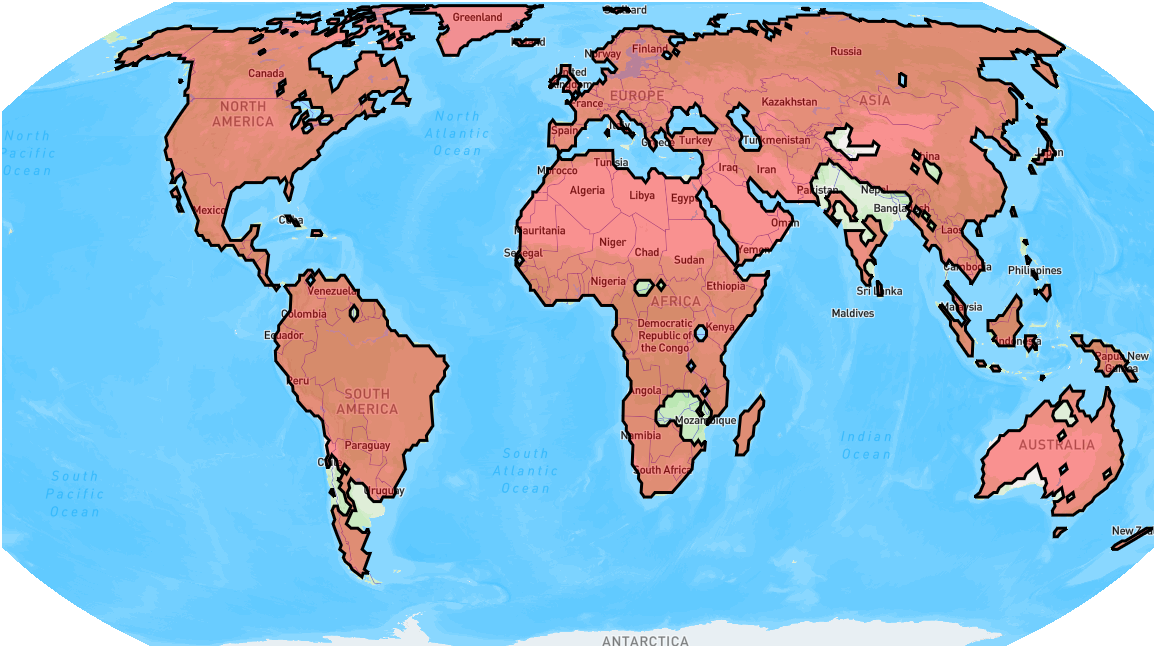
A quick search of the Mapbox documentation doesn't indicate a way to specify an even-odd fill rule when filling GeoJSON polygons. I could've missed it but this Observable notebook presents two alternative solutions.

The first suggests that you fix the holes using MapShaper. To do so, simply upload your GeoJSON, open the MapShaper console, and execute

clean rewind

The second solution uses D3 to overlay an SVG on top of the map. This works since SVG does implement an even-odd winding rule. The Javascript code is a bit more complicated, since it needs to coordinate the two images. It works pretty well, though, and it does so on the fly.

In both cases, you get a map that looks a lot like so:

enter image description here

3
  • Hey! Thanks a lot for your answer. What I need to do however is to do this dynamically in the browser. Do you happen to know what type of tooling mapshaper uses in the background to do the rewinding?
    – Flavio
    Commented Aug 28, 2023 at 22:03
  • Ahh - when you mentioned that you tried Turf, I guessed that a solution where you modified the data file was acceptable. I modified my response and the linked notebook to suggest a second alternative that uses D3 to overlay an SVG on top of the map. I don't think there's a pure Mapbox solution but I might have missed it. I know Mapbox pretty well but I know D3 much better still. Commented Aug 29, 2023 at 12:11
  • I figured it out (see answer above). Thanks for your help though.
    – Flavio
    Commented Aug 29, 2023 at 12:50

Your Answer

By clicking “Post Your Answer”, you agree to our terms of service and acknowledge you have read our privacy policy.

Not the answer you're looking for? Browse other questions tagged or ask your own question.