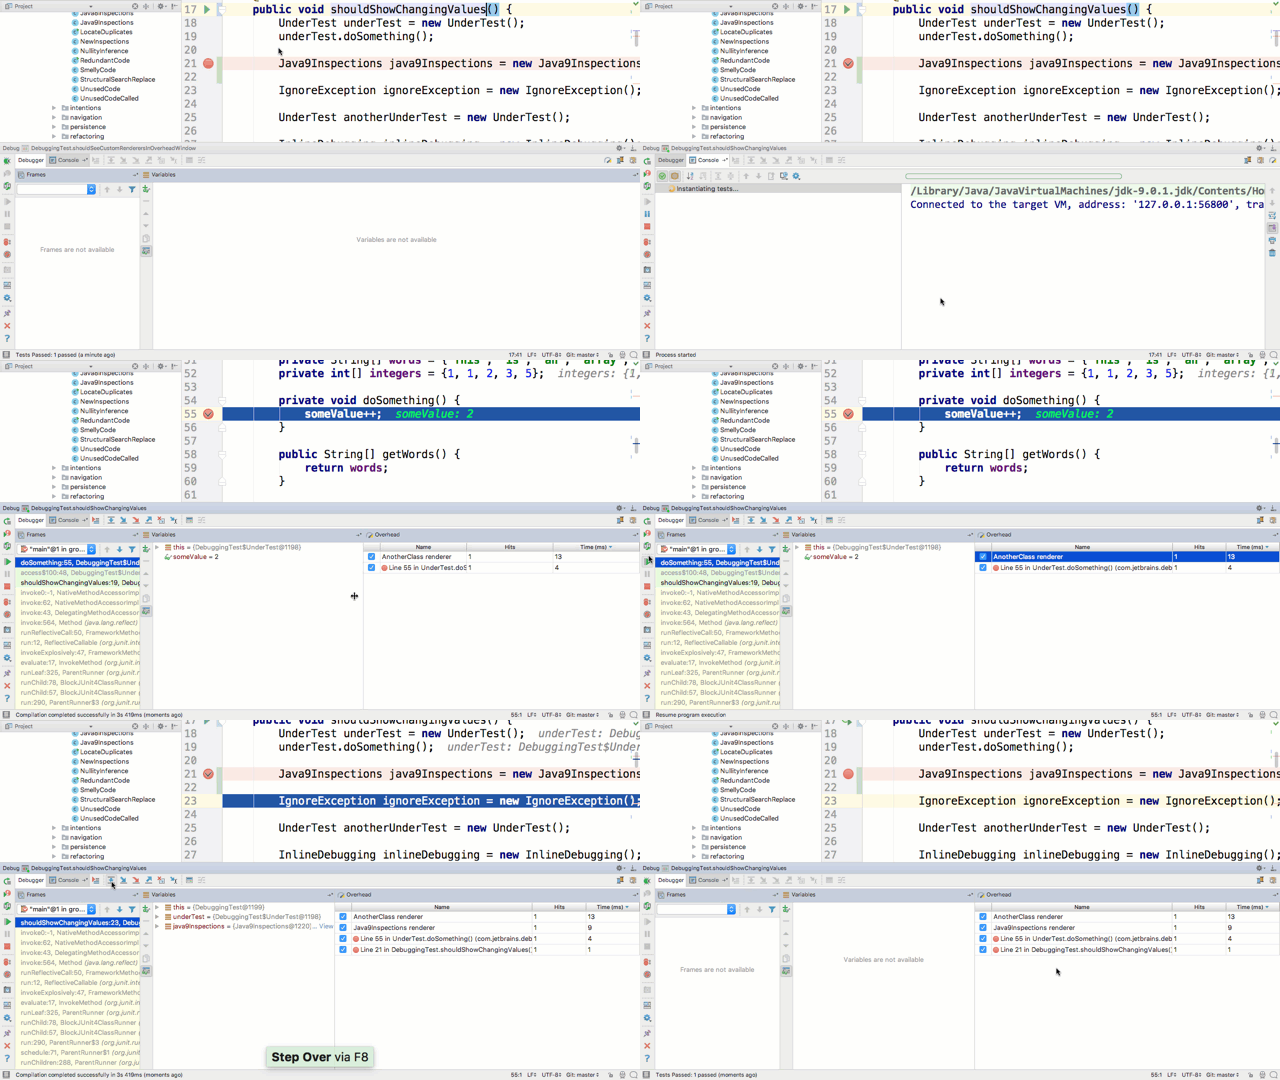
TL;DR: It shows you the "performance loss" of using the debugger.
Since Android Studio is based on the IntelliJ IDEA, you may find some information about this feature here:
https://blog.jetbrains.com/idea/2017/09/whats-new-in-intellij-idea-2017-3-eap/
As its name suggests, this tab shows you the overhead added either
when stepping over the code or when Data Renderers evaluates values to
display them in Variables, Watches, or other places.
And even more infos (including a small gif showing the feature) here:
https://blog.jetbrains.com/idea/2017/12/intellij-idea-2017-3-debugger-improvements/
Where they state:
Debugging an application comes with an inevitable cost. While we may
know this, it’s not always obvious what this might be. IntelliJ IDEA
2017.3 comes with a way to visualise this cost. There’s now a new tab, Overhead, which gives a view of the cost of debugging. [...]
As you can see, this window shows how much time was spent stepping over code, or rendering values with custom Type Renderers in watches and variables. Seeing this overhead may help you to understand the difference in behaviour between running and debugging your application, and will help you to reduce unnecessary performance costs when debugging.
Here is the gif animation showing it's usage:


